Good morning
Traders,
This week we are featuring a report from Damon Verial - our Gap Trader discussing how he uses gaps to read the stock market. Try Damon's service for only $1 for 1 month by clicking the links below and using the Discount Code listed.
Market Outlook: What the Gaps Are Telling Us
I watch gaps every day for trading opportunities. I can play up gaps or down gaps. Typically, I play them 50/50 up-down. But last Friday we saw 565 stocks gap down, whereas only 4 stocks gapped up (not
counting inverse ETFs).
Rarely do I care about the market as a whole when trading gaps, but the 565:4 ratio in down gaps to up gaps is pessimistic for the market as a whole. The divergence between these numbers were so strong that I’m looking at the market itself to see if a possible gap play exists on the SPY or QQQ.
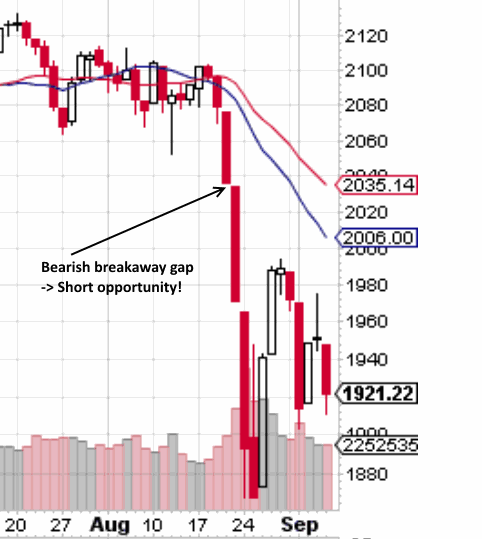
However, I have not seen a playable gap in the past week on the market as a whole. Though I could have told
you two weeks ago, upon witnessing the first down gap in the SPX that 2035 would have been a good value to short:
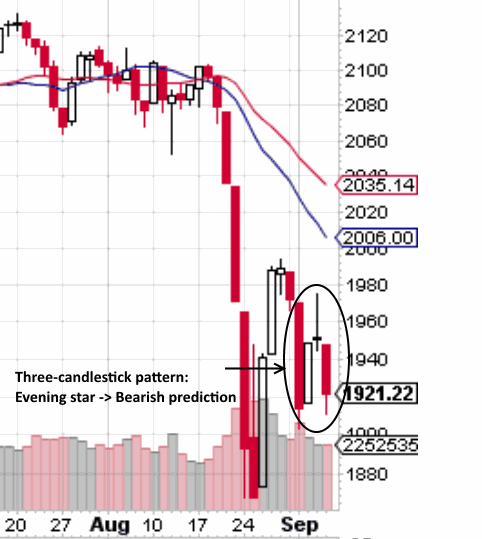
But just looking at this chart, I can see another common pattern – one that goes hand-in-hand with gaps: the evening star. This is a very bearish pattern, as it represents a failed attempt at investors trying to “buy the dip.” It’s likely the market will fall on Tuesday.
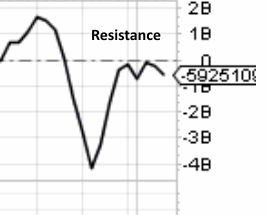
Then there’s the Chaikin oscillator, which has recently become one of my favorite indicators. It’s hard to understand because it’s much like a derivative of a derivative in calculus: It’s an indicator of an indicator of an indicator. But for the most part, it gives you an idea of the future of money flow into the market. In this case, we see
resistance at the break-even point of 0, and the line is beginning another decent. Investors are likely to be pulling more money out of the market next week. I myself recently wrote some QQQ call options.
Looking at individual gaps, I find many that are of interest. Let’s start with some ETFs before looking at individual stocks. I’ll offer some trading strategies for each.
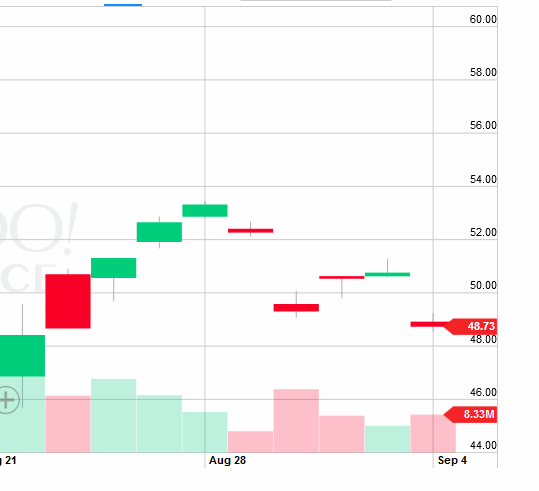
Japan Hedged Equity ETF (DXJ)This is a “hedged” fund in that it claims not to suffer from a falling exchange rate of the Yen to Dollar. So
far, it has held true to this claim, climbing while the Yen has fallen. However, recently, it took a huge dive.
I often watch the DXJ because it’s what I call a “gappy” stock. I shows gaps nearly every day. But Friday’s gap was remarkable in that it took us out of the “up area filling” pattern. That is, we have a new breakaway signal. However, because the gap was not accompanied with a large volume nor did it take us to a new low, this is not a gap to
worry about. In fact, this gap is quite playable.
I predict a fall in the price of DXJ for the first couple days of the week, followed by a bullish reversal. This ETF is worth buying at the current low. After all, the portfolio of DXJ is mainly composed of value stocks, giving it a solid fundamental basis. Taken as a market statement, the Japanese market, while at a low, is positioned to bounce
back, if only slightly. Set your sell limit order at $50.61.
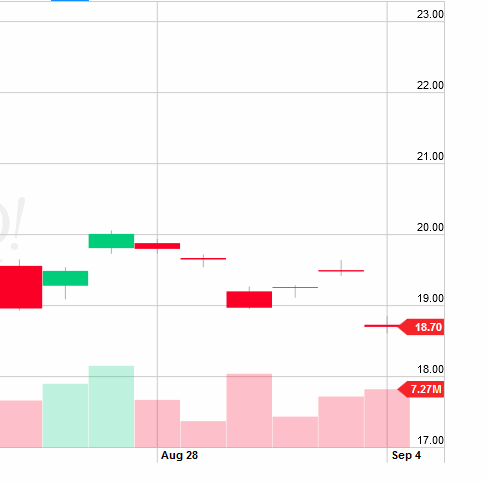
India Earnings Fund (EPI)India’s market looks similar to that of Japan’s on the chart.
It’s pretty much the same play. Just realize that neither DXJ nor EPI are good investments. Play the gaps and you shall prevail; invest at this moment and you might find yourself tripping on your own feet. My advice would be to instead find a stock within the Japanese or Indian market with a similar gap and strong fundamentals; play that stock
instead of the market as a whole.
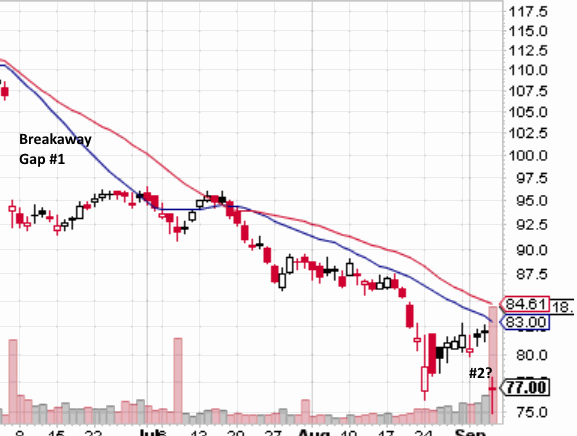
Cooper (COO)As for individual stocks, let’s start with COO. It’s now at a new low, despite the huge white candlestick the day of its gap:
The volume on the day of the gap is large enough to allow us to suspect that the gap is a breakaway or continuation gap; that is, that the stock will continue falling. With the white candlestick, we might actually be at a relative high, giving us a strong short opportunity. I predict COO to continue to fall. Short this stock or buy a put if
you’re willing to take the risk. Otherwise, wait until you see a candlestick pattern that shows a weak bull pattern followed by a strong bear pattern, such as the falling three candlestick pattern:
If you see such a pattern, we are nearly 90% sure that we are on a downward continuation gap and can safely play puts on the stock. Because we are at a new low, we have no support in sight, so I have no way of predicting how big your ROI will be – just that it should be big if you buy ITM put
options.
India’s market looks similar to that of Japan’s on the chart. It’s pretty much the same play. Just realize that neither DXJ nor EPI are good investments. Play the gaps and you shall prevail; invest at this moment and you might find yourself tripping on your own feet. My advice would be to instead find a stock within the Japanese or Indian market with a similar gap and strong fundamentals; play that stock instead of the market as a
whole.
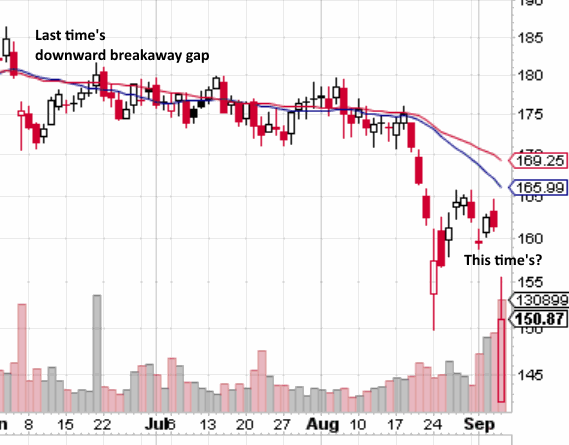
Esterline Tech (ESL)Next is Esterline Tech, which provides products to the US military and industrial complex. This stock has dropped with a breakaway gap.
This looks like a pretty safe bear play based on its volume, its new low, and its history for having big breakaway gaps. Your best bet for this play is to wait for money to see if we are in the same region. I predict a matching low, at which point we can be very confident that we are in the beginning of a downward trend. Then it’s your chance to
short (or buy put options). I might get in on this one myself.
To follow along with these trades, click any of the links below and use Discount Code PGS1 to get your first month for only $1:
Regards,
Carl Adams, Publisher
www.stockbarometer.com
|
|
|