PLANETARY LINES
the best price forecasting tool
If you are interested in how to forecast the most important supports e resistances, you better read this article
Everyone knows what a resistance
or a support is. What usually we don’t know is the reason of why the Market founds resistance or support to a precise level. This is exactly what I study, and after 15 years of studies, the best answer I have found is: the Planetary Lines. Most of the people are scared when they hear the word “Planet”, but we know that history doesn’t change, and every new idea is seen with a suspicious mind. We can see it every day in trading, blind trust in ignorance hope but we refuse to use our eyes to see
if something really works, just because we “feel” it cannot work. I can claim that the study of the price is the most important tool of my personal trading, and you can see with your eyes that it is a successful trading looking at this my personal activity statement: http://www.iaminwallstreet.com/IB_Activity_Statement_Futures.PDFSo, you probably can follow me with more interest now. How do I do that? Continue reading and you will see, it is all about to know the main trend and where to see the confirmation, and the Planetary Lines can give you these clues.
The Planetary Line is a method used for the first time
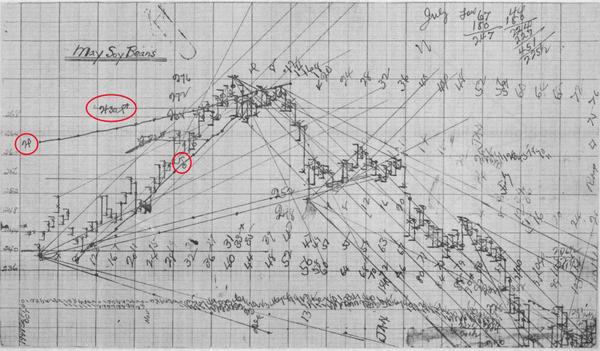
by William Delbert Gann (for what we know), we have the proof of it from his own Charts: |
If you look with attention at this chart made by Gann in 1949, you can see some lines with a planetary symbols next to them. These are the planetary lines. But what is a Planetary Line? It is the path in degrees of the
Planet in a bi-dimensional chart. It sounds harder than how it is, but it is simply explained, we just need to explain it step by step: we know every Planet moves around the Sun. We use the degrees to say where a specific Planet is in the space, and the degrees go from 0° to 360° because this is how we measure the angle in a circle. For example, we can have the Planet Jupiter at 225°, it means Jupiter is 225° apart from the 0° point which is where the constellation of Aries begins. Now,
how do we track the Planet Jupiter on a chart? Easy: it will be exactly at 225$ or points (I know you have already many questions… just wait, one step at a time). If tomorrow Jupiter is at 226°, we will have to mark the Jupiter level at 226$ and so on…
Let’s see a first example to make this concept clear: The pointer is at $345 on the 21st of August 1986, exactly on the blue line (click on the image to enlarge it in the website page). The blue line is Jupiter, and you can read from the chart above that Jupiter was at 345°. Like we said before, if
Jupiter is at 345°, it will be on the chart at $345 on that day. Because of the movement of the Planet, everyday it changes the position, it means it changes the degrees, and on our chart we see this change as a line.
This is the simple base of how it works. We can see the Planets from different perspective, because we can see them from the Sun (called Heliocentric system) or from the Earth (called Geocentric system), but this is not something we need
to understand at the beginning. Your next question is probably this: how can I use the Gann Planetary Lines if I trade an instrument that has a value of 0.20$, or a value over $360? And here we have to introduce 2 new rules about the GPL:
1 - you always add a circle (360°) to any planet to have higher lines. For example, if we have Jupiter at 225°, it means that Jupiter
“vibrates” at 225$, but also at 225+360=585$, and also at 585+360=945$ and so on. We use again the chart of Gold to make you understand this concept:
On the 1st of February, 1980 Jupiter in Heliocentric was at 153°, and we said it is vibrating at $153. But it was also vibrating at:
153+360=$513
and at
513+360=$873
You can see the effect of this lines, which stopped perfectly the uptrend in January 1980. Gold found a support around the Jupiter Planetary Line in March-May 1980, during a sideways and choppy period. In December we see again a perfect
support, a break out with a gap down in January 1981 and a perfect resistance on the same line in February. The gap-down in December and the resistance in February was a clear signal of weakness, no reason to have LONG positions as long as Gold remained below the Jupiter Line. Here you already have an example about how the Planetary Lines work, and how they are so important for my personal trading.
2 - we are
using the value “1” as a ratio between the Planetary Line, it means that we have a movement of 1$ every movement of the planet of 1 degree. You can use a different ratio, and if you use a very little ratio, like 0,001, it means that your line on the chart will move 0,001$ every 1° of movement of the Planet. And, if we have Jupiter at 225°, at this ratio the Planet will vibrate at 0,225$.
I know you are now getting
confused, and this is normal, too many information in the same time. You will probably need to read it more than once, but trust me, this is very important. Unfortunately this is just the beginning, but you can start seeing how the lines work.
Considering all the ratios you can use and the Planets, you have to know that there is a deep and wonderful geometry
behind all this. Have you noted that usually people are good to show perfect geometry only after it happened? Too easy! Considering I’m a real trader, I need to be able to forecast where the Market finds resistance or support, this is the immense advantage of the Planetary Lines, but we need to spend a lot of time to study which is the right geometry for each Market.
I gave the first proof of how the Planetary
Lines can forecast important tops or bottoms in the 2012 S&P500 Bulletin, when, in January 2012, I said:
Let’s turn to the prices: according to my studies, the S&P500 is working in a price range between area 1290-1296 (-30 margin points) and 1473-1500 points. Indeed, at the moment, my main target in the S&P500 is the area 1473-1500. If this price is reached, the S&P500 can begin to go down, but
everything depends on WHEN this price is reached. Moreover, if the S&P500 retraces to the area 1260-1295 without having reached the first target at 1473-1500, this can be a very good BUY point. But as I said before, everything depends on WHEN. It is possible to understand that a High at 1475 in August could be a good opportunity to SELL and in the same way a Low around 1280 points in October could be a great opportunity to
BUY.
|
The chart shows a Low in June at 1266.74 and a High in September at 1474.51 points. The S&P500 remained inside the price range I forecast, and I gave a very tradable information: if the S&P500 retraces to the area 1260-1295 without having reached the first target at 1473-1500, this could be a very good BUY point. When the S&P500 touched 1260-1295 in June, it didn’t reach the
target 1473-1500 before, it means we had to buy with stop under 1260 points, and we could trade 200 points in profit. This is what I mean when I say that Planetary Lines can make you understand when to buy and where to put the stops.
Right now, Autumn 2015, we were expecting to find a strong support in area 1875 Index Points of the S&P500, and this support worked very well.
How can it work? The reply is the
same like if you ask to a chemist how it is possible that electrons move in precise geometric paths, or how it is possible that nature shows precise geometry in trees and flowers! The answer is the harmony, but I’m sure you have already heard about all these wonderful words, and you are probably fed up with all these people telling you that harmony is all around, and you have to study it, but no one of them is showing you how to actually make money! Well, that’s again exactly what I do! Because
never forget that you have to make money, and you know you have to act like a trader, not like a magician! But in trading looks like everyone wants to be a magician. This is not a good approach.
I use Market Analyst 8 for studying the Market and drawing the Planetary Lines, it offers a
complete tool to create what we really need to calculate the most important support and resistance lines.
Best Regards, Daniele Prandelli
I Am in Wall Street Ltd
High Probaility Trading Techniques - S&P500, Crude Oil, Gold, Corn, Soybeans, Forex, Stocks, Silver, Live Cattle and S&P/ASX200.
DISCLAIMER It should not be assumed that the methods, techniques, strategies or indicators presented by e-mail, e-book, blog or files will be profitable or that they will not result in losses. There is no assurance that the strategies and methods presented in here will be successful for you. Past results are not necessarily indicative of future performance. The
examples presented here are for educational purposes only. The data used is believed to be from reliable sources but cannot be guaranteed. The methods presented are not solicitations of any order to buy or sell. The author, publisher, and all affiliates assume no responsibility for your trading results, and will not be liable for any loss, damage or liability directly or indirectly caused by the usage of this material. There is considerable risk of loss in Futures, Stock and Options trading. You
should only use risk capital in all such endeavours.
|
|
|