| OGSR Wireline January 2016
|
Hi ,
Welcome to the first quarterly edition of our newsletter. We are very excited to launch this series as we believe that the
highest quality of information is a fundamental requirement for the responsible harvesting of energy and for environmental management.
This edition covers various aspects related to data and data management. Jordan reviews library and industry activity in 2015 and provides some insight into 2016. Nikki then examines how drilling data is collected and used. Matt discusses
the importance of data quality. Our featured article, by Lee Fortner, Sedimentary Geologist at the Ministry of Natural Resources and Forestry, explores the role that new technologies and data have played in exploration and development in the oil and gas industry in Ontario.
We hope that these articles will provide a glimpse into the workings of the OGSR Library. We welcome
any comments or feedback that you may have.
Jordan, Nikki, and Matt.
|
2015 Review and Opportunity Knocks for 2016
by Jordan Clark, Manager | The 5 Ws of Drilling Data at the OGSR Library
by Nikki Fortner, Data/Operations Administrator | Quality Inputs, Quality Outputs
by Matt Marotta, GIS & Database Technician |
Continue Reading for Full Stories
|
When Seismic came to Ontario
by Lee Fortner,
MNRF Sedimentary Geologist | Monthly Drilling Report - December 2015
1 New Licence Issued
4 New Licences Issued for Existing Wells
1 Well Plugged
| Announcements
OPI Conference
Production Submission Deadline |
2015 Review and opportunity knocks for 2016 Happy New Year to all our clients and friends in the petroleum and subsurface industry! As 2016 begins it is a good time to reflect on industry activity of the previous year and make some forecasts for the year to
come. Industry sentiment in 2015 certainly indicated that things were shaping up to be quite lean. With the final drilling numbers in for the year that sentiment seems confirmed, however production numbers have yet to be reported so a true judgement on the year will have to wait. So far 2016 is off to a sour start regarding the current level of oil prices. Nevertheless Ontario's fundamentals of low operating costs remain intact. The growing gulf between the CAD and
USD at least offers some silver lining to those with production and may provide an opportunity for outside investors and potential partnerships. Perhaps 2016 will be the start of a turnaround for Ontario's historic downhill slide.
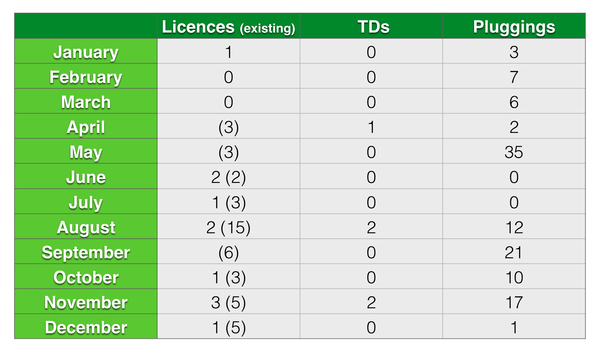
2015 likely marks the first year since 1857 that not a single oil well was drilled in Ontario. Let's look at 2015 drilling numbers; a total of five wells were recorded to have reached total depth last year. Of these five wells two were for natural gas storage, two were stratigraphic tests, and one development well was drilled for natural gas (see table 1 below). The natural gas well is currently listed as active. Although records for the 19th century a somewhat spotty 2015 likely marks the first year since 1857 that
not a single oil well was drilled in Ontario, 1858 of course being the famous year that North America's first commercial well was dug here in Lambton county. The data does show a reasonable number of pluggings for the year, mainly attributed to the abandoned works program, that serve to keep rigs active in the area. Table 1: 2015 Industry Activity. Although 2015 drilling counts are the worst ever you only have to look back to 2006 to see 95 wells drilled in the province, or the 1990's when drilling averaged over 100
wells per year, or the nearly eight decade streak prior that averaged over 200 wells per year (with some years recording over 400 wells).
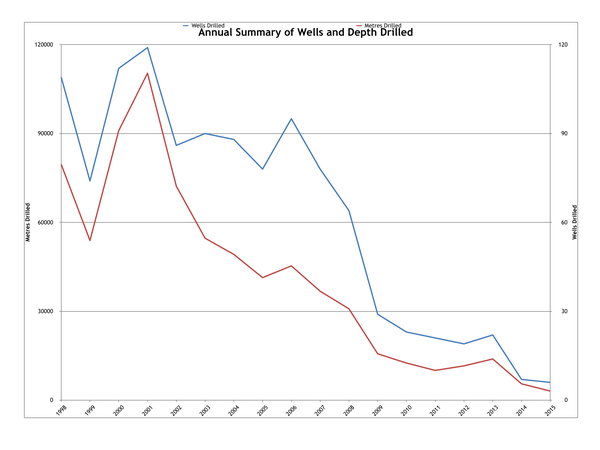
We can see looking at Figure 1 below that this decline in drilling starts began around 2008. It therefore stands to reason that any opportunities existing then have not been fully explored or developed. Figure 1: Drilling starts and total annual depth drilled from 1998 to 2015. Shallow opportunities in Ontario have always been inexpensive to access, so much so that in the 19th century a spring board drill was enough to get the job done. Oil Springs and Petrolia pools were both discovered by inexpensive means and from a geologic
point of view represent world class reservoirs, as has been noted by several presenters at the OPI annual conference. Although exploration at this depth may be more exhausted than any other the low costs still make it an attractive opportunity.
Middle depths are famous for the large reef structures that exist mainly in Lambton county and in Huron county, to a lesser extent. Although these structures
have been thoroughly explored for using seismic, there are still other targets to be examined in this interval. Users of the Library's free PxTools will probably know that the Library maintains a database of seismic line locations based on annual submissions. Reef fever that brought intensive shooting
of seismic lines to Lambton county was done to a somewhat lesser extent outside the county's borders meaning good areas for seismic data collection could still exist. Another Ontario advantage is having the built in gridding, in terms of roadways, to facilitate collection of new seismic datasets.
Admittedly, the current state of Ontario's seismic databanks is a sore point from a data management point of
view. As Ontario's primary data provider we have heard repeatedly the difficulty with acquiring or accessing seismic data shot in the province. Many of the original operators that shot seismic no longer exist in the province and the ownership and disposition of the data has become muddled over time. One of the Library's main focuses in 2016 will be to improve our existing seismic database by allowing owners to register and market their data through our various online
platforms. Hopefully the Ontario Seismic Exchange marketplace will create a more efficient environment for the sale, trade, and flow of seismic data within the province.
It is often stated that half of Ontario's petroleum reserves may still be in place. This claim should specifically be applied to the deeper units of Ontario as it originates from an Ordovician study published in 2005. Returning to Figure 1, we can see that although drilling starts began to fall in earnest in 2008, it was back in 2002 when deep drilling started to slide. Even following the release of a major study on the typically deep Ordovician units in 2005 exploration and
development in this deeper horizon were both falling at a faster rate than exploration and development in shallower horizons. The net result of this is that even with a major study released on the subject deep exploration and development has not been seriously exploited in over a decade now. The results of the 2005 study are still very relevant today without much deep exploration, and opportunities at this level remain mostly intact from the early 2000's when deep drilling began to
slide.
Although 2015 was one of the slowest in terms of drilling numbers it was one of the busiest at the Library in terms of data production. Last year we partnered with several government departments and local operators to produce new public and private datasets. Thanks to these partnerships our normal staff count of three was able to increase to eight full and part time workers all busy producing
data for use by the industry. This lead to a complete collection of all records scanned and available online, digital copies of many other record series were created (including the journals of R.B. Harkness), a geologic review of samples from 1,200 wells, new digital facility data, many new scanned maps available in PxTools.
The move to all digital documents has allowed operators to access more data than
ever before from their offices and in the field. As expected, foot traffic in the Library from file researchers has dropped significantly but an increase has been marked in the number of cores and cutting being viewed by explorers and researchers.
In 2016, we have already secured several partnerships that will allow us to continue producing and refining data to be
used by the petroleum industry and research community. We hope to improve general awareness of existing seismic data sets and making discovery, trading, and marketing of the data more efficient. Our archives of over 1,100 drill cores and chip samples from over 12,000 wells stand ready for researches to test their new theses. Even the most modest leg up in 2016 would mean a doubling or tripling of drilling starts for exploration and development and the Library is ready to help
by providing any data you may need to get there. The 5 Ws of Drilling Data at the OGSR Library |
Who are the parties involved?
A key role of the Oil, Gas and Salt Resources (OGSR) Library is to collect and collate data related to oil, gas and salt resources operations in Ontario. At specific stages during the operations process, information related to the drilling activity must be submitted to the Ministry of Natural Resources and Forestry (MNRF) to satisfy
the Provincial Operating Standards. The OGSR Library manages this data and provides a public portal into the drilling activity occurring in the province.
What data are collected?
One of the first steps in the drilling process is to obtain a well licence from the MNRF. The licencing procedure ensures that the operator follows the requirements set out in the Oil, Gas and Salt Resources Act. An application for a drilling licence includes the surface
data, the drilling program, and proposed casing and cementing program. At this point, the operator indicates the geological target for the well.
The Form 7 (Drilling and Completion Report), completed by the operator, details the surface and subsurface record for the particular well,
including the initial gas, oil and water records, the casing and tubing records, and any logging and coring records. This form also documents any well treatments and stimulation, and drillstem testing. Additionally, OGSR Library collects and archives cuttings and/or core associated with the drilling process. Data pertaining to exploratory wells are considered confidential and public access is withheld for one year.
Additionally, the operator of any licenced
well outlined in the Oil, Gas and Salt Resources Act is required to submit Well Status ( Form 3) and Production Values ( Form 8). These forms provide the operational status, as well as the volume of any oil, gas and brine produced from each well.
| | When are the data collected?
The operator of a well is required to update MNRF continually about the status of licenced wells. However, there are specific reporting requirements for some operations. The Drilling and Completion Report is submitted within sixty days after the end of drilling. When a well
is plugged, a Plugging Report is required within 30 days of the plugging.
Well Status and Production Forms are submitted annually by February 15.
Where are the data stored?
The OGSR Library houses the physical files on site and are accessible to industry professionals and the public. The data collected from these forms are also entered into databases that allow for queries and reports to be generated. The data can be accessed through OGSR Library’s website. Sub-surface records, obtained from the Drilling and Completion Report, are only accessible by members of the Library. The cuttings and core associated with each well are also
archived on-site in a warehouse.
Why are the data collected?
For
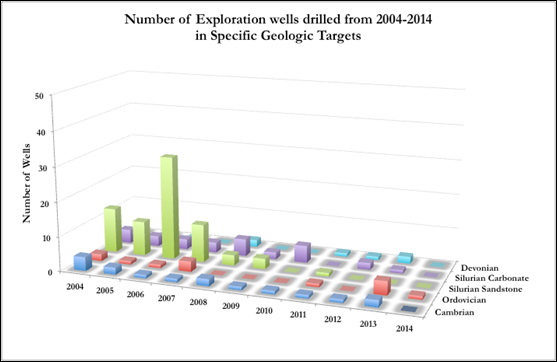
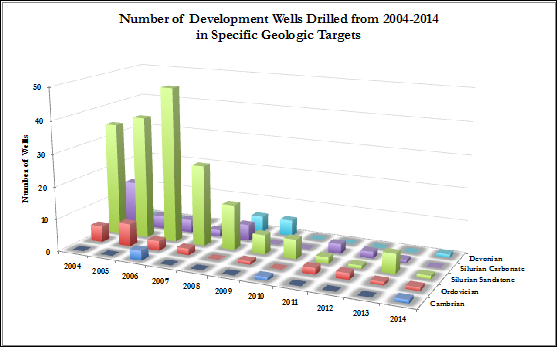
example, the data collected from the Licence Application and Well Completion Reports can be used to display trends of exploration and development in specific geologic zones. Figures 1 and 2 display the number of wells drilled in different geologic zones over a ten-year span. The apparent trend could be attributed to declining economic conditions.
Using the OGSR Library’s data to look at overall trends is essential to the work of industry professionals
and academics in their studies of petroleum resources in Ontario. |
Figure 1: Number of exploration wells drilled in a ten-year period in specific geologic zones. Figure 2: Number of development wells drilled in a ten-year period in specific geologic zones. |
Quality Inputs, Quality Outputs The OGSR Library is packed with data, from the core
in our warehouse to the nearly 27,000 digital and physical well files. All of these data serve the Petroleum industry in Ontario, informing many decisions that will inevitably influence the future. The existence of such data is therefore very important, with data quality being equally as important, but often overlooked.
This time of year is especially important when it comes to data quality as annual production figures are calculated and submitted to the
Library. There is a tremendous amount of time and effort going into these data, not only on our end to review and process the information, but also on the operator’s end to tabulate everything from the past year. Inevitably, production data will not be perfect due to the sheer volume of information that must be processed and the many people involved in processing it. We devote a lot of time and resources to Quality Assurance and Quality Control of production data, often times
as a result of minor reporting errors. Since there is no practical way to validate every single value submitted on every single form, errors can go unnoticed. Such errors will then find their way into the tasks, projects, and decisions based around production data, ultimately influencing the quality of the output from that work.
We always stand behind our data because we have confidence in our practices, experience, and, most importantly, the people reporting
the data to us. Together, we can ensure the continued distribution of high quality data throughout the industry and constantly strive to produce data that is of even higher quality. It can be as simple as spending a few extra minutes verifying that all fields have been completed and completed accurately. With over 100 operators submitting production data each and every year, a collective effort to assess data quality before submission is the
simplest and most effective means of ensuring quality inputs that translate into quality outputs. |
The Impact of the Incorporation of Seismic Methods on the Exploration and Production History of the Oil and Gas Industry in Ontario. The incorporation of seismic surveys into exploration and development workflows changed the industry’s approach to selecting well locations. Where a company chooses to purchase existing seismic data or acquire new surveys, the additional information can greatly alter the risk
assessment of a given drilling location or even redirect the decision-making process such that prospect inventories and potential drilling locations are entirely different from what would have existed in the absence of seismic data. Historically, the operational changes that resulted from the incorporation of seismic methods clearly have had a profound positive effect on success rate. The improvement can be demonstrated by examining historical drilling and production records for
various measures of success and plotting that information versus time.
The Ontario Petroleum Data System (OPDS) is the database of petroleum wells maintained by the Petroleum Operations Section (POS) of the Ministry of Natural Resources and Forestry. The OPDS database currently includes records of more than 26,000 separate boreholes in Ontario that fall under the regulatory jurisdiction of the POS.
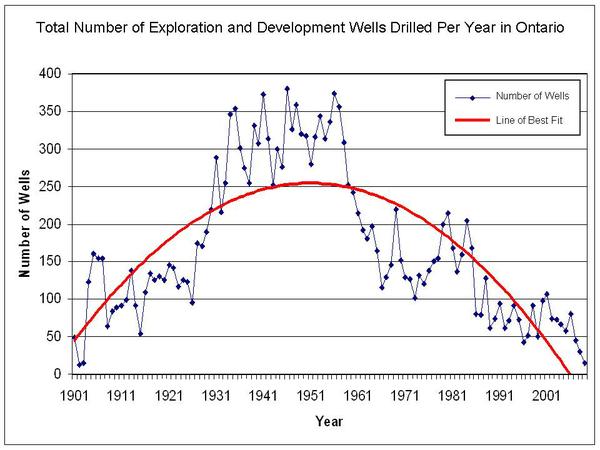
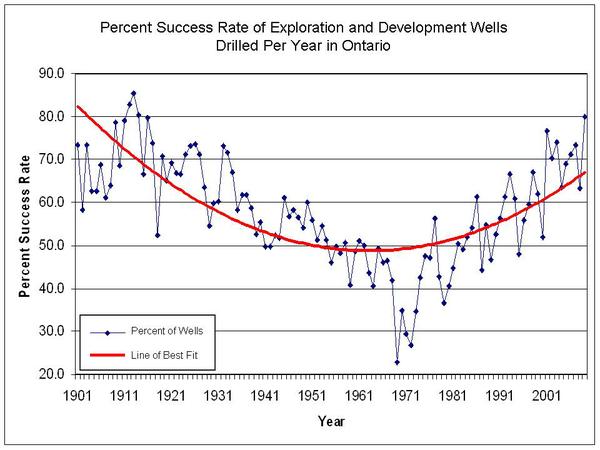
When displayed graphically, the OPDS well data strongly indicate the positive influence of the incorporation of seismic data into drilling programs during the last century.
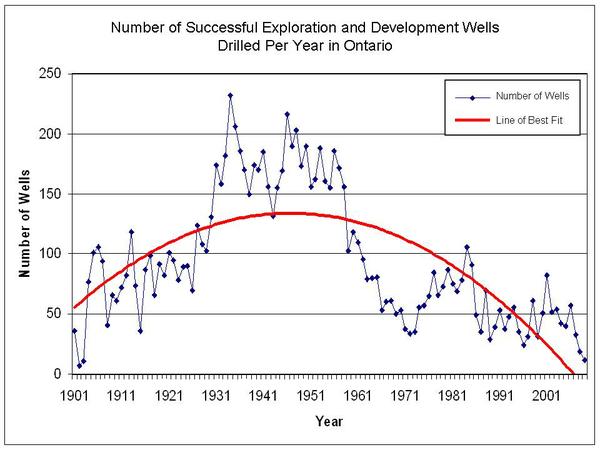
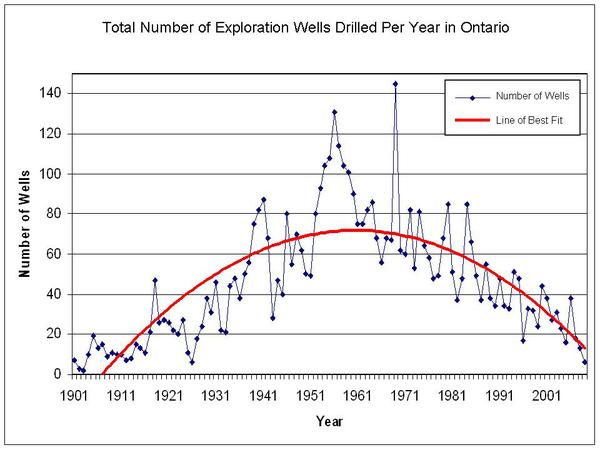
Figure 1 displays the total number of oil or gas exploration plus development wells drilled in the province since 1901. The increase in the frequency of drilling from about 1930 to the late 1950s, as drilling and production technology
advanced and world oil and gas consumption rose, is closely matched in Figure 2 by the number of wells deemed successful for those same years. A line of best fit is displayed on each graph to illustrate the general trend of the values. |
Figure 1. Total number of exploration and development wells. | Figure 2. Total successful exploration and development wells. |
Figure 3 displays a clearly different trend from the previous two graphs. When plotted as a success rate by percentage, the line of best fit
curves upwards. This is likely the result of a typical drop-off from the high discovery rate in the early stages of commercial development of a basin or play type followed by the increased success rate that occurs later from the introduction of new technology. The development of new technology is driven, in part, by the feedback of a decreasing success rate. Figure 3. Success rate of exploration and development wells. |
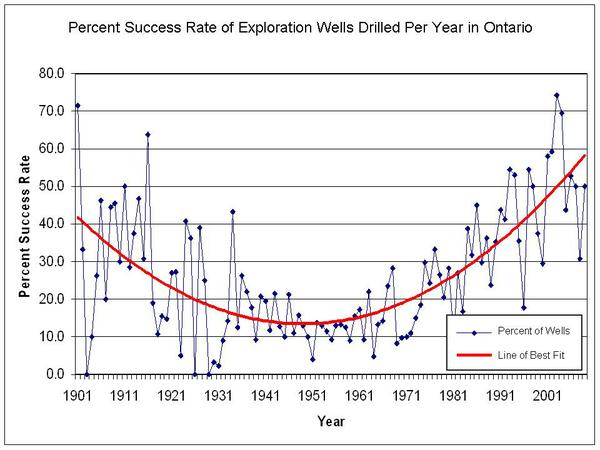
When development
wells are excluded from the list so that only exploration wells are graphed, the success trend is enhanced. Figure 4 displays the total number of exploration wells drilled, with Figure 5 including only those exploration wells deemed successful. Again, there is an increase in the amount of drilling apparent during the first half of the last century. This well number increase is accompanied by a decrease in success rate until the middle part of the century, at which time the
success rate ‘bottoms’ and begins to curve upwards. In percentage terms, the increase in success rate is more dramatic when development wells are excluded and only exploration wells are considered. |
Figure 4. Total number of exploration wells. | Figure 5. Success rate of exploration wells. |
It is a common expectation that the largest and/or the most accessible oil and gas accumulations within a region are discovered and delineated first. As time passes, the size of accumulations remaining to be discovered generally decreases, and
the difficulty of accessing remaining pools increases. This accounts for the drop in the success rate of exploration and development wells with time somewhat independently of the absolute number of wells drilled. Note that while the amount of drilling is increasing from 1901 to the 1950s, the success rate falls fairly consistently within the same period.
However, the success rate trendlines in Figures 3 and 5 stabilise at about
1960 and climb steadily after the early 1970s. The most notable change in the history of exploration and development to coincide with this trend reversal is the incorporation of seismic data into the decision-making process for drilling locations. The earliest records of seismic data acquisition in Ontario maintained at the Oil, Gas and Salt Resources (OGSR) Library in London occur from 1966. That year, surveys were shot by BP Exploration Canada Ltd., Imperial Oil Enterprises
Ltd., and Ashland Oil and Refining Co. in the Counties of Lambton and Elgin. As seismic imaging technology improved from the 1960s to the 1980s, success rates of oil and gas exploration and development increased, as indicated in the above graphs.
The most striking example of the impact of seismic data on the results of exploration and development in Ontario is that of the Middle Ordovician Trenton-Black
River (TBR) Group hydrothermal dolomite (HTD) play.
Hydrothermal dolomites are recognized to occur in many basins around the world. They are closely associated with deep faults that conduct hot mineralized water through limestone in the subsurface. This process locally alters the limestone to dolomite, thereby creating porosity that can contain hydrocarbons. Reservoirs are confined laterally by
non-porous, unaltered limestone. Resulting pools are mapped as long narrow features several kilometres in length but less than one kilometre in width (Carter et al., 1996).
The first commercial production of gas from the TBR in Ontario occurred from the Hepworth pool, discovered in Bruce County in 1900 (Sanford, 1961). The Dover pool was discovered by wildcat drilling in 1917 (Lauriston, 1961).
Following the discovery of the Dover Pool, 17 additional TBR HTD pools were discovered before 1983, but exploration success was constrained by the lack of a modern exploration model and the lack of reliable exploration methods (Carter and Trevail, 2008). The extensive use of seismic surveys after 1983 resulted in the discovery of 39 additional TBR HTD pools (Carter and Trevail, 2008).
In addition to the drilling data stored in OPDS,
historical oil and gas production data are available from the OGSR Library. Production information can be sorted by various criteria and success of hydrocarbon exploration and development can be indicated by production volumes.
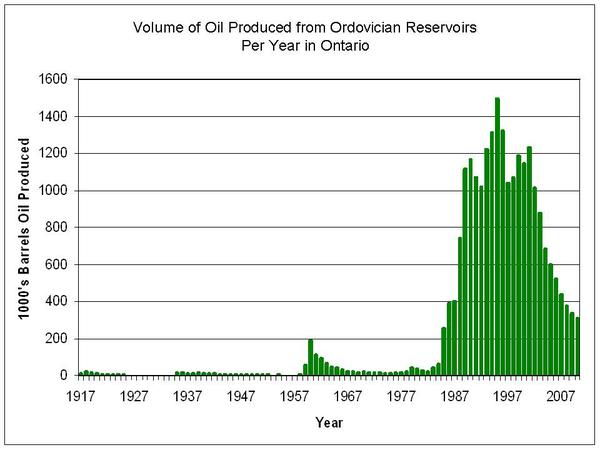
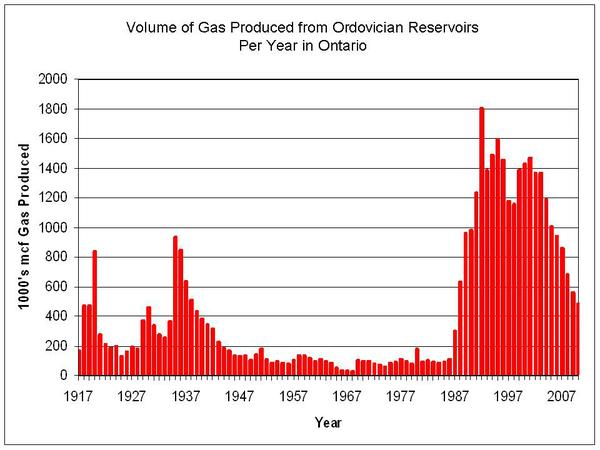
As the HTD play in Ontario occurs only in Ordovician-aged reservoirs, data that are filtered to include only production from reservoirs of this age can be used as a rough gauge of the
success of the HTD play. Figure 6 displays oil production from Ordovician reservoirs in Ontario. Figure 7 displays gas production. The change in production values on both graphs is dramatic, and coincides with the extensive use of seismic surveys to explore for and delineate HTD reservoirs beginning in the 1980s. |
Figure 6. Volume of oil produced from Ordovician reservoirs in Ontario. | Figure 7. Volume of gas produced from Ordovician reservoirs in
Ontario. |
It is evident from the available data that the inclusion of seismic surveys within exploration and development programs significantly improved the historical success rate for the oil and gas industry in Ontario. Improved success rates of drilling coincide with the introduction of this technology to
the province in the 1960s. Seismic technology experienced significant advances over the following 20 years, and the radically improved production volumes from Ordovician-aged reservoirs coincide with the targeted use of seismic imaging for exploration and delineation of hydrothermal dolomite reservoirs beginning in the 1980s.
References Carter, T.R., Trevail,
R.A., and Easton, R.M., 1996. Basement controls on some hydrocarbon traps in Southern Ontario, Canada. In: van der Pluijm, B.A. and Catacosinos, P.A., eds., Basement and Basins of Eastern North America. Geological Society of America Special Paper 308, pp. 95-107.
Carter, T.R. and Trevail, R.A., 2008. The Ontario phase of the Trenton-Black River (TBR) hydrothermal dolomite (HTD) play: Historical context and
contributions to a modern exploration model. American Association of Petroleum Geologists, 2008 Eastern Section Meeting, Pittsburgh, PA.
Lauriston, V., 1961. Blue Flame of Service: A History of Union Gas Company and the Natural Gas Industry in Southwestern Ontario. 126 p.
Sanford, B.V., 1961. Subsurface stratigraphy of Ordovician
rocks in southwestern Ontario. Geological Survey of Canada Paper 60-26. 54 p. |
December 2015
New Licences Issued
| Licence No. | Issue Date | Operator | Township | County | Status | TD (m) | | T012464 | Dec 12, 2015 | St. Mary's Cement Inc. | Darlington | Durham | LIC/NDR | 254.00 |
New Licences Issued for Existing Wells | Licence No. | Issue Date | Operator | Township | County | Status | TD (m) | | T012457 | Dec 2, 2015 | Private | Rainham | Haldimand | PGP/ACT | 277.98 | | T012465 | Dec 11, 2015 | Private | Rainham | Haldimand | PGP/ACT | 278.89 | | T012466 | Dec 11, 2015 | Private | Rainham | Haldimand | PGP/ACT | 271.88 | | T012467 | Dec 11, 2015 | Racher, Rick | Enniskillen | Lambton | OP/SUS | - |
Wells Plugged | Licence No. | Plug Date | Operator | Township | County | Status | TD (m) | | T008396 | Feb 7, 1996 | Enbridge Gas Distribution Inc.
| Moore | Lambton | NGS/ACT | 776.00 |
|
|
The annual deadline for the submission of Production Forms to the Ministry of
Natural Resources and Forestry is quickly approaching. Updated Form 3s and Form 8s should be used for data
integrity. |
If you are having trouble viewing this newsletter, it can be downloaded here. |
Follow:

|
|
|
|
|