| OGSR Wireline By OGSR Library
April 2016 |
Hi ,
The April 2016 edition of OGSR Wireline marks our fourth overall publication and second quarterly publication. As promised, we have delivered more
content in this edition than the past two monthly issues. Our subscriber base continues to grow while we are recognizing the importance of this newsletter for keeping the industry informed and showing folks unfamiliar with the Library what we have to offer.
In this edition, Jordan discusses major events in the life of the Library.. Nikki then provides a sneak peek into 2015 production
figures. Matt will walk you through many of the mapping services offered by the Library and provide visual examples of what we can do. Lastly, we will provide the details about the upcoming 2016 OPI Conference to spark some last minute registration and promote the range of exciting events that have been planned.
As always, we welcome any comments or feedback that you may have.
Jordan, Nikki, and Matt.
|
Major Events in the Life of the Library
by Jordan Clark, Manager | Sneak-a-Peek:
2015 Production
by Nikki Fortner, Data/Operations
Administrator | Mapping Matters
by Matt Marotta, GIS and Database Technician |
Continue Reading for Full Stories
|
OPI 54th Annual Conference and Trade Show: Details/Agenda
Wednesday May 4th - Friday May 6th, 2016
DoubleTree by Hilton, London Ontario
| Monthly Drilling Report - March 2015
1 New Licence Issued
4 New Licences Issued for Existing Wells
1 Well Plugged
| Quick Tip
How to View Higher Reoslution
Scans
|
Major Events in the Life of the Library --
Including some data and services you may have forgotten about
Our mission at the Oil, Gas & Salt
Resources Library is bringing the highest quality data to our clients, industry partners, landowners and other members of the public. At the core of our operations are the various well files, sample cuttings, and rock cores held at our facility on London, Ontario. Providing safe, clean and friendly access to this data has been top priority since the Oil, Gas and Salt Resources Trust began operating the OGSR Library in 1998. A lot has changed in the time since then, technologically speaking, and
in terms of industry trends. The Library has steadily increased our services and datasets over time in an effort to make data easier to access and more reliable. The brief timeline below highlights some major milestones throughout the years in data quality and Library services; read below and you may find some services and data that you've forgotten about over the years!
1998
The Ontario Oil, Gas and Salt Resources
Library begins operations. Access to Ontario's subsurface data is now being managed by a trust funded by the petroleum industry.
1999
www.ogsrlibrary.com goes live. Only a year into operations and in the heat of the dot com boom era the Library gets an online presence and begins offering basic downloads and reports.
2001
Ontario Petroleum Data System (OPDS)
major data entry initiative. The source of nearly all geology, engineering and well data that we post today comes from Petroleum Operation's OPDS database. This database is used on a daily basis to track most aspects of Ontario's petroleum wells and contains information on every known well. However, in the early days thousand of records were missing and tens of thousands incomplete. In partnership with the Ministry of Natural Resources and Forestry (MNRF) the Library began a seven year long
process of data entry to enter and verify 27,000 well files. Hundreds of thousands of rows of data (over 500,000 rows of geology alone) and millions of individual fields were populated to create a dataset that acts as the backbone to digital operations.
Updates to OPDS allow more accurate and complete maps to be created. The Library can begin offering large format plotting services of client maps and creation of custom maps that combine any of the data fields in
OPDS.
2003
Library begins working with the Ontario Ministry of Natural Resources, Ontario Geological Survey (OGS), and Natural Resources Canada (NRCAN) on the Targeted Geoscience Initiative (TGI). The Library acts as data provider and provider of basic data services adding great value at low cost. Partnerships between the Library and various levels of government have been crucial to the success of the Library and we would like to
sincerely thank all of our government and industry partners throughout the years.
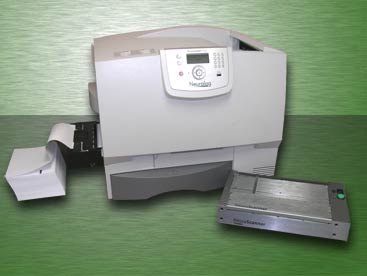
Along with data research the Library also picked up some very important assets through the TGI project. Geophysical log scanning, printing, digitizing, and cross-section generating software was acquired through TGI and we still offer all of these services today, at very reasonable prices! This equipment is absolutely essential to the Library's operations as Ontario's petroleum data
hub.
2007
Work is finally winding down on our major data entry project, only a couple thousand files to go now, and attention can finally be brought to other projects. Digitization of geophysical logs is a priority and about 5,000 logs are traced from images to LAS using software acquired via TGI. Any log at the Library can be ordered as LAS for one low flat fee.
Our online well card search goes live!
With so much data finally in OPDS the Library website gets a major revamp and well cards are added for the first time. Members can now view all the geology and engineering data without needing to drive to London. Well card access grows and currently serves over 100,000 well cards views annually, just to registered members, far more than were ever viewed in person at the Library facility.
2008
Petroleum exploration tools
(PxTools) mapping overlays for Google Earth are created. All wells, pools, pipelines and a myriad of other data can be viewed by anyone with a copy of the free software. Data is automatically refreshed on a weekly basis.
OPDS initial data entry is finished but data integrity checking is just beginning. In the pursuit of the highest quality dataset the Library and MNRF partner on a two year project to correct major errors in the OPDS database and improve data
accuracy and reliability.
The Library sets out to create a production database. Production search is still done on paper and tracking the history of individual wells, especially ones that move between operators, is a difficult and tedious task. Work begins with the philosophy that all digital data must be linked back to an original document to assure the users of the data's quality. After many years of OPDS data entry lessons in data integrity were learned and applied
here. Over 70,000 images are made by scanning all historic production documents. The Library establishes a policy of scanning both sides of every page, even if that page is blank, so users can perform a "digital page flip" and assure themselves that data was not missed. Records from 1897 to the current year are available as PDF. Each image is then assigned to an operator and year so a simple query will return an operational history for each company. Each well from 1967 (the first year production
was reported on a per-well basis) to the current year is tagged. Now a simple query can be used to find all data for a single well. Each month of production data from 1992 (the first year data was recorded monthly) is entered. Production is now fully digital and can be searched, aggregated, and charted; nearly 700,000 rows of monthly production data are entered.
2012
Library scans all geophysical logs. Using the TGI scanner, once
again, the Library completes the catalogue of geophysical log scans and makes all scans available online to members. Work is done file-by-file to ensure nothing is missed, all 27,000 files are searched manually for logs that may be missing from the database. The Library searches another 27,000 files held at MNRF to remove all geophysical logs. Both sets of logs are compared to create the ultimate master set of logs, totalling 21,000, all scanned and available online to members. A new
microfiche scanner also allowed us to recover several logs lost to both paper sets. Duplicate logs from MNRF are boxed and 160 boxes are sent to the Ontario's archives to act as an offsite backup.
2013
Scanning of all well files held at the Library is underway. Over the next two years all 27,000 well files will be scanned and added to the website. Providing access to these documents finally allows clients to search missing data
not captured by OPDS and very importantly to verify the digital data they are seeing in the various geology and well tables. Scans are always made double-sided and at high quality. Every single item in each folder is scanned or imaged in some way, including the unbinding and scanning of all reports, nothing is left undone. Over 500,000 scanned images are posted on the website. All new forms and all changes, no matter how small, added to each file are scanned before being placed in the folder.
The Library runs an automated process to post scans from a local folder to the website, making updates fast, efficient, and easy.
2014
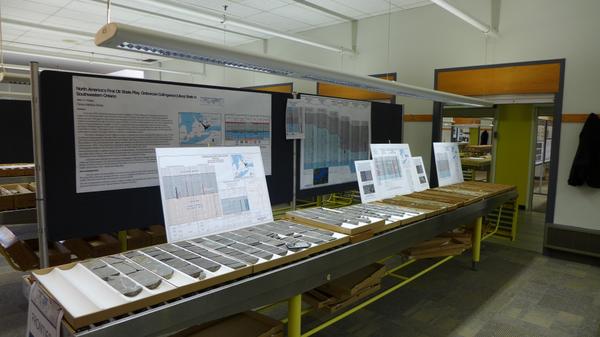
Geological structure maps are added to PxTools. The first annual edition of the Pools & Pipelines Map is released with a focus on year-over-last pool production data.
Thanks to a special donation by Charlie Fairbank high resolution core imaging is added to the list of
Library services. Ontario Geological Survey orders the photography of several cores, adding to Ontario's geoscience databanks. Each photo is done at over 35 megapixels as dry core under white light, wet core under white light, and dry core under ultraviolet light to capture fluorescence. For the first time clients have a way of viewing rocks remotely. Although it may not serve as a full replacement for viewing core in person it is a handy way of previewing core before visiting the Library to
help your day be more productive in the facility, or as a way to keep a record for a report or presentation. 25 cores have been photographed.
2015
A facilities map layer is created. Historic maps and facility data are added to PxTools. Disposal reports are turned into an Excel database. MNRF releases three major volumes on Ontario's subsurface waters as Open File Data Releases published through the Library
website.
Another partnership is formed with MNRF and NRCAN to review and improve the quality of Ontario's geological data. Geologists hired by the Library review over 3,000 wells and verify or change 80,000 formation top picks. These picks are recorded in the OPDS database under "MNR" source geology and a special code identifies the data as being verified by a geologist. The partnership with NRCAN to review and improve geology is scheduled to continue to 2017. The final
result will be a three dimensional geological and hydrogeological model covering most of southern Ontario.
TODAY
We have a special data release and as newsletter subscribers you're among the first people to receive a link to the data! A series of figures and tables from the Final Report on Oil & Gas Potential of Ontario by Bailey Geological Services Ltd. and Robert O. Cochrane that were prepared but never released, until
now:
Stay tuned because we've got several more data releases planned for this year and lots of ongoing quality assurance efforts!
Sneak-a-Peek: 2015 Production |
According to the Provincial Operating Standards, an operator of a well is required to submit a
Form 3, (Annual Well Status Report) and a Form 8 (Annual Report of Monthly Well Production) to the Ministry of Natural Resources and Forestry on/or before February 15. These forms facilitate tabulation of the production from the preceding calendar year.
Data are processed and summarized by the OGSR Library and are often used to gauge industry activity. These data are also used to update the Annual Pools
and Pipelines Map that is published in July. Source documents are available in the Library for viewing and will be available to members on-line when all the documents have been collected.
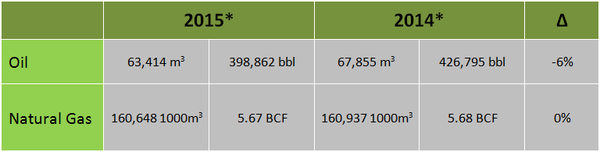
The following is a glimpse into the data that has been collected thus far.
Table 1: A comparison of 2015 and 2014 oil and natural
gas production. * Only comparing Operators that submitted in both 2015 and 2014
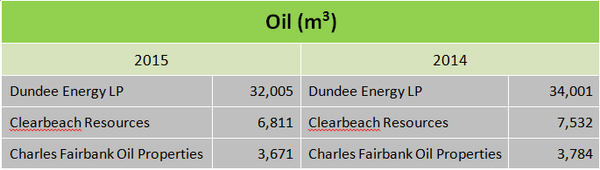
Table 2: A comparison of the top three producers of oil in 2015 and 2014.
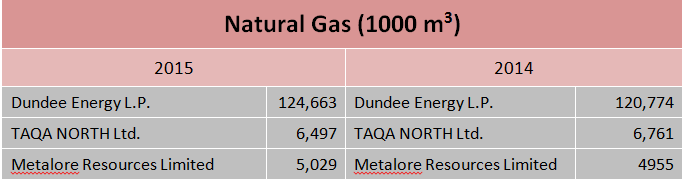
Table 3: A comparison of the top three producers of natural gas in 2015 and 2014.
|
Geologizing is a process, and maps help to bridge the gap between data
and information in that process. Think about having only raw numbers at your disposal when investigating any geologic formation. Sure – thickness or elevation values could still be interpolated from picks, but that creates more numbers for your brain to process. By assigning colours to numbers in the form of a map, we instantly turn data into information that is much easier to process. This is just one example of how maps are useful tools in the field of geology. Here at the OGSR
Library, we have the capability to produce many different types of maps. This article will explain many of the maps that we can create to help turn data into much more useful information. |
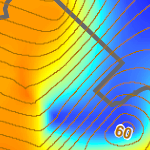
Isopach / Structure
Isopach and structure maps are created from our database of geology picks. We can create isopach layers of any formation
(ex. Queenston) or range of formations (ex. Queenston to Collingwood). We can also create structure layers for any formation, which can be used independently or processed further to create contours. Structure contours are commonly placed atop an isopach layer, as seen in the sample map below illustrating Queenston Structure Contours on Queenston Isopach. Contour intervals can be customized to your liking. Keep in mind that both isopach and structure layers are interpolated using the
picks available for that formation; we mainly use the Natural Neighbour interpolation method.
We can include any other layers in these maps that would help with interpreting the information. Other common layers include: - Faults
- Location of GeoGeo/Seismic data
- Petroleum Pools (all, certain ages, certain type/status)
- Customized prospect areas
The image below is an example map showing Queenston Structure Contours on Queenston Isopach. Click here to view the full map. You'll notice that both the isopach and
structure contour layers have been clipped to the edge of the Queenston formation. This can be done for any formation as we have spatial data available representing the edge of each formation. |
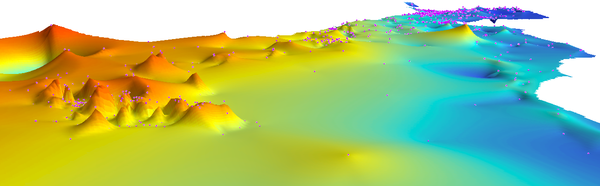
3D
Three-dimensional maps are typically most useful to pinpoint errors and anomalies in interpolated layers. We have the capability to represent any interpolated layer in three-dimensions and overlay the wells that contain the picks used to make the layer. From here, we apply a vertical
exaggeration so that subtle changes are much more defined. Then, we view the vertically exaggerated layer and look for any unusual spikes or peaks. A spike or peak that is far away from any other wells usually means that the pick is erroneous. An example of an isopach layer with wells (tiny pink dots) can be seen in the image below; this is the same layer used to create the sample map above. Lastly, we note the licence numbers of the wells with potential erroneous picks and
investigate the corresponding formation picks for each well. If appropriate, we will adjust the picks in our central database so that other users are accessing corrected data. Most importantly, we will re-create the interpolated layers from the corrected data.
With three-dimensional data, we can also render a video fly through of the information that is represented in the
layer. |
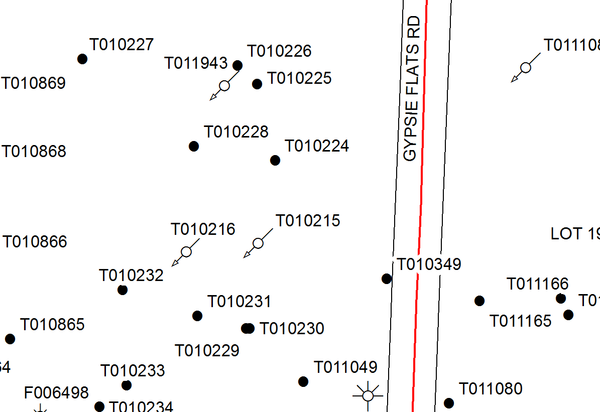
Basemaps and well location maps are fairly straightforward. Basemaps will show
features such as roads, municipal/regional boundaries and bodies of water. A well location map usually contains basemap data along with Petroleum wells located in the area. Petroleum wells are symbolized according to their type and mode and can be labeled with license numbers, names, operator, and many other attributes. Either map can contain any other layer that we have available, such as conservation areas and wetlands. | |
Using water well data, we can create an isopach layer of dominant material (clay, silt, etc.) in a given area. These data are also represented by an interpolated layer using the Natural Neighbour method. Any other data that we have available can be placed on top of these isopach layers, such as structural contours of a specific formation.
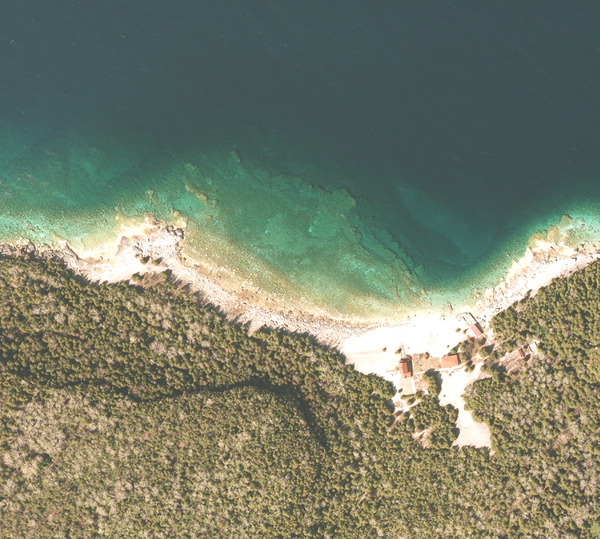
Satellite Imagery /
Orthophotos |
We have a wide variety of satellite imagery and orthophotos available to use in any maps. Maps can be comprised of strictly satellite imagery and orthophotos, or can contain other layers on top. For example, one might want to view transparent petroleum pools on top of satellite imagery. The most recent and highest quality data available at this time are orthophotos from
the 2010 Southwestern Ontario Orthophotograghy Project (SWOOP). 2010 SWOOP orthophotos cover southwestern Ontario just shy of Lake Simcoe at a resolution of 20 centimetres.
The image to the right is 2010 Orthoimagery (SWOOP) from Flowerpot Island. | | |
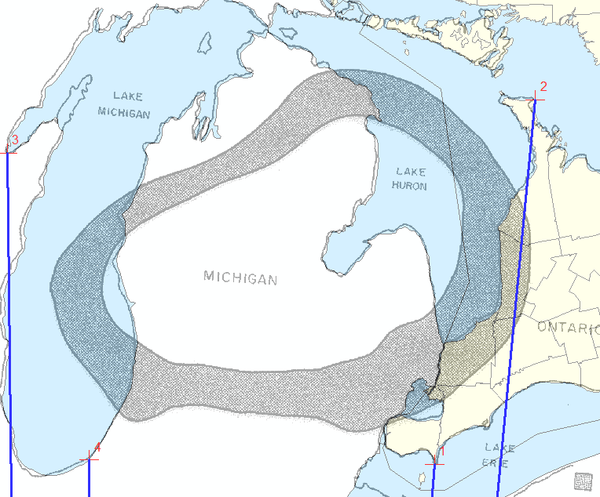
Scanned & Georeferenced
Historic paper maps are often a useful compliment to certain analyses and can sometimes be the only remaining evidence of a well or other geological phenomena. We can scan documents up to 8.5 inches in-house, while we can arrange for larger documents to be scanned by local companies. Scanned maps can
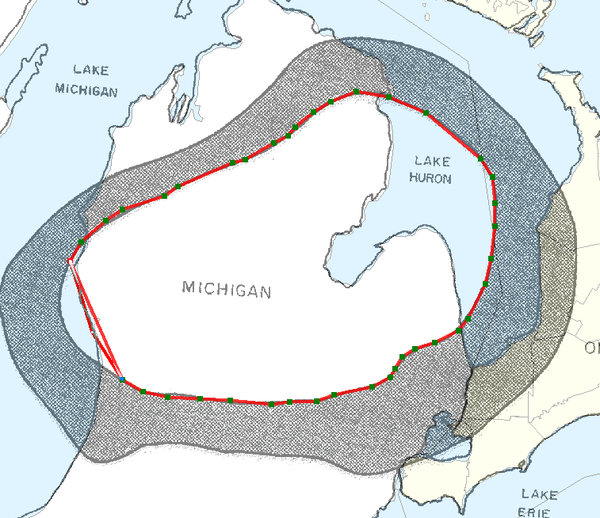
then be georeferenced for analyses with other spatial data. The image below illustrates Georeferencing an older diagram. The diagram is transparent so that the base layers below are visible. Digitization
Features found in orthophotos, georeferenced maps, diagrams, or any other source can be digitized and turned into a spatial data
format. The image below illustrates digitizing the feature of interest from the georeferenced image above. Map Books
Sometimes a single map is impractical for real world applications. For mapping large areas, or even small areas at a high level of
detail, map books are extremely useful because they are mobile. Map books can feature an index, custom index grid and tabular data corresponding to each map.
All of the maps and data products mentioned in this article can be delivered to you across a variety of mediums. We
can plot physical copies of maps in-house, deliver them to you digitally or provide the files on a USB drive. Our plotter is capable of printing documents sized 42 inches by upwards of a couple hundred inches.
What you want to visualize is completely up to you. We can combine any number of the mapping and data techniques described above in order to achieve your desired result. We can work with you to develop a
customized solution if you know what you want but are unsure how to get there. Contact us to take advantage of the many mapping services we have to offer and unlock the true potential of spatial data visualization! |
54th Annual OPI Conference and Trade Show |
| May 4 – 6, 2016
DoubleTree by Hilton
London, Ontario | |
Elexco Ltd. Fairbank Oil Properties
Layfield Environmental
LimeGREEN Equipment Rental
Matrix Solutions Inc.
Oil, Gas & Salt Resources Library/OPI
Oil Museum of Canada
Ontario Geological Survey
Stream-Flo Industries
Weatherford
Canada
Wellmaster Pipe & Supply | GOLD
Elexco Ltd.
Harold Marcus Limited
Oil, Gas & Salt Resources Library
SILVER
American Refining Group
Dundee Energy LP
Holland Testers Ltd.
Weatherford Canada
West Bay Exploration
BRONZE
East Coast Energy Inc.
Ecan Energy Inc.
Jim McIntosh Petroleum
Engineering Ltd.
Ont. Inc. 2354978 Oil & Gas Energy (Ed Welychka)
Wellmaster Pipe & Supply Inc.
FRIENDS OF OPI
Ray Neal Accounting |
May 4, 2016
10:00 am – 3:00 pm: Core Workshop (Library)
12:00 pm – 4:00 pm: Exhibitor set up (Grand Ballroom Centre)
12:00 pm - 4:45pm: Quarry Field Trip (additional fee)
1:00 pm – 4:30 pm: Short Course (Duke of Albany)
5:30 pm – 7:30 pm:
Welcoming Reception (Grand Ballroom Centre)
6:00 pm – 9:00 pm: Prospect Expo (Windsor Club)
May 5, 2016
7:45 Authors & Speakers Breakfast (by invitation only)
8:20 Opening Remarks (Grand Ballroom East)
8:30 Opening Speaker: Bob Delaney MPP, Streetsville-Mississauga and Parliamentary Assistant to the Ontario Minister of
Energy
Session One (Grand Ballroom East)
Past in Perspective
Session Chair: Jug Manocha, Ministry of Natural Resources & Forestry, London, ON
9:00 “Application of Unconventional Technologies to Appalachian Basin Conventional Reservoirs”; Dan Billman, Billman Geologic Consultants, Inc., Houston, PA
9:30 “The Impact of the Incorporation of Seismic Methods on Petroleum Exploration and Production
History in Ontario”; Lee Fortner, Ministry of Natural Resources & Forestry, London, ON
10:00 “The History of the Antrim Shale in Michigan”; William Harrison, Professor Emeritus and Director, Western Michigan University, Kalamazoo, MI
10:30 Coffee Break (Grand Ballroom Centre)
Session Two (Grand Ballroom East)
Powering the Future
Session Chair: Mike Learn, Union Gas Limited, Chatham,
ON
10:45 “Risk Assessment of Contaminated Sites Using Computer Modelling”; Cam Baker, Matrix Solutions Inc., Breslau, ON
| 11:15 "Using a combination of chemo-, bio-, and sequence stratigraphy to resolve the chronostratigraphic relationships of Niagara-Lower Salina Reef Complexes throughout the Michigan Basin"; Matthew Rine, Western Michigan University, Kalamazoo, MI
11:45 "Shale Gas and Oil - Perspectives from Western and Northern Canada";
Brad J. Hayes, Canadian
Society of Petroleum Geologists, Calgary, AB
12:15 Luncheon Keynote Speaker: Bill Thornton, Deputy Minister, Ontario Ministry of Natural Resources and Forestry (Grand Ballroom Centre)
Session Three (Grand Ballroom East)
Building the Base for
Tomorrow
Session Chair: Muntazir Pardhan, Dillon Consulting Limited, London, ON
1:30 “An Ordovician (Black River) water flood project in the Dover East Field, SW Ontario, Canada”; Simon Brame, Nomis Energy Inc., Calgary, AB
2:00 “Sharing the Resources along with the
Responsibilities: Our Shared Energy Future”; Dean Jacobs, Consultation Manager, Walpole Island First Nation, Wallaceburg, ON
2:30 “The Dangers of Using Online Geophysical Data”; J.P. Fagan, Centennial Geoscience, Inc., Littleton, CO
3:00 Coffee Break (Grand Ballroom
Centre)
Session Four (Grand Ballroom East)
Great Expectations
Session Chair: Shelley Kilby, Ministry of Natural Resources & Forestry, London, ON
3:15 “A Canadian Energy Strategy"; Gary Locke, Bowman Centre, Sarnia, ON 3:45 “The Marriage of Nuclear with Natural Gas: Low Emission Affordable Electricity”; Paul Acchione, Market Intelligence & Data
Analysis Corporation, Woodbridge, ON
5:00 Wine & Cheese Reception (Grand Ballroom Centre)
6:45 Labatt Beer Tour, 150 Simcoe Street, London
May 6, 2016
9:30 Golf & BBQ Lunch (additional cost) Maple Ridge Golf Club, 3950 Dundas St., London
|
Thank you for attending the OPI Oil & Gas Trade Show. We hope you
enjoy! |
March 2015 New Licences
Issued
| Licence No. | Issue Date | Operator | County | Township | Status | TD (m) | | T012483 | 2016/03/31 | Enbridge Gas Distribution Inc. | Lambton | Moore | LIC/NDR |
|
New Licences Issued for Existing Wells
| Licence No. | Issue Date | Operator | County | Township | Status | TD (m) | | T012444 | 2015/07/23 | Kettle and
Stoney Point First Nation | Lambton | Bosanquet | OBS/SUS | 65.1 | | T012481 | 2016/03/03 | Wikwemikong
Unceded - Indian Oil and Gas Canada | Manitoulin | Indian Reserve no. 26 | OS/ABD |
| | T012482 | 2016/03/08 | Wikwemikong Unceded -
Indian Oil and Gas Canada | Manitoulin | Indian Reserve no. 26 | OS/ABD |
| | T012484 | 2016/03/31 | Reference | Haldimand | North Cayuga | PGP/SUS | 220.98 |
Wells Plugged
| Licence No. | Plug Date | Operator | County | Township | Status | TD (m) | | T004140 | 2015/12/22 | Plains Midstream Canada ULC | Essex | Sandwich West | LPG/ABD | 478.84 |
|
Quick Tip: How to View Higher Resolution Scans
All library documents are scanned at 300dpi and all geophysical logs at 400dpi. The
Scans tab and Logs tab show images lowered to screen resolution of 72dpi to help with page loading speeds. Documents can be viewed at the original 300dpi by clicking on them. Logs must be purchased for 400dpi.
If you are having trouble viewing this newsletter, it can be viewed here. |
Follow:

|
|
|
|
|